Cost per completed task, not cost per token
Leaderboards measure somebody else's tasks. Compare measures yours, in your environment, and reports the number that decides it.
A cheap model that needs three attempts costs more than an expensive one that succeeds first time. Only one of those numbers appears on a leaderboard.
Cost per token is an input. Cost per completed task is the output you are actually buying, and it is the one figure that changes a decision in a steering meeting.
The arithmetic illustrative shape, not a result
| Measure | Candidate A | Candidate B |
|---|---|---|
| Cost per million tokens | lower | higher |
| Attempts per completed task | more | fewer |
| Cost per completed task | higher | lower |
What a run measures
The same tasks, one candidate at a time, scored by an executable check. One run can put a local model beside two hosted ones on the same provider; hosted provider and frontier API routes are in build.
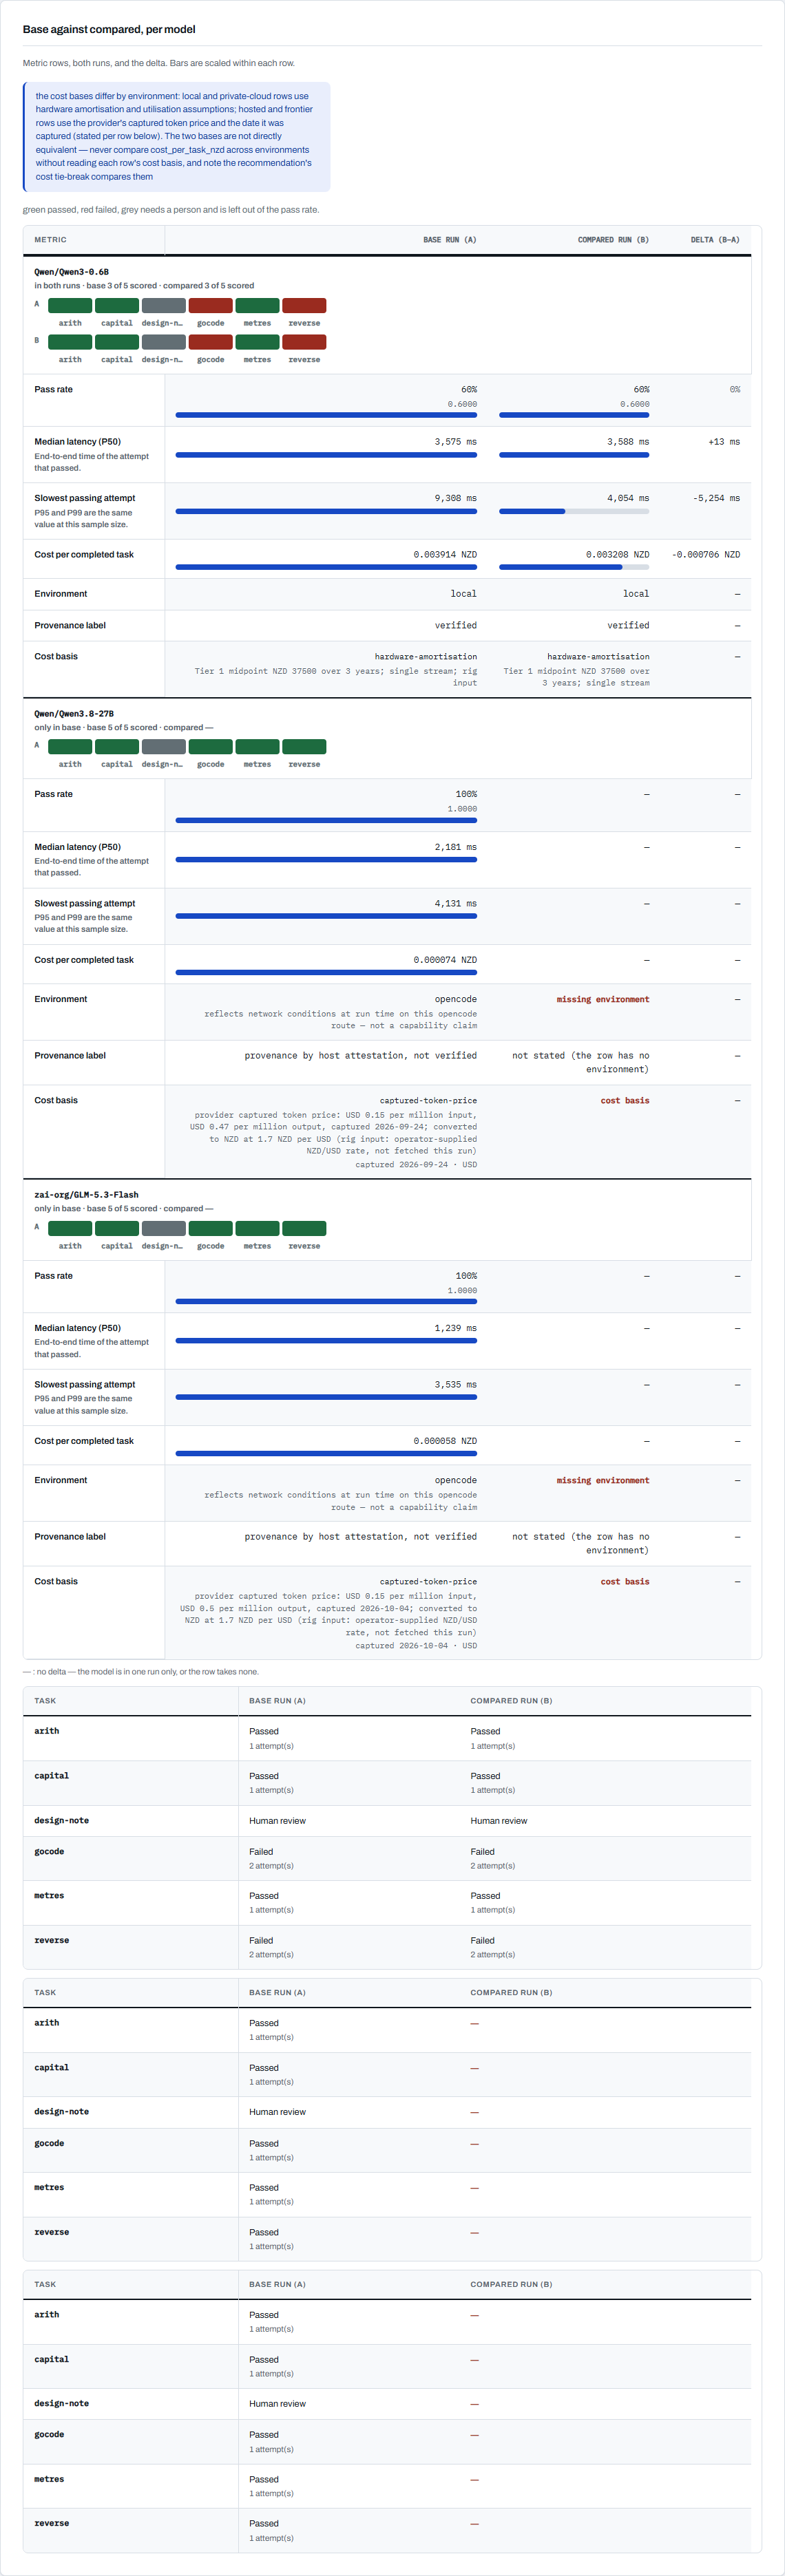

One task set on one laptop. The two hosted rows are real calls to the named provider through the hook, but what that provider serves is not byte-checked, and the local row's latency is this laptop's, not a hardware claim. Provider routing is in build.
| Metric | How it is produced |
|---|---|
| MetricTask pass rate | How it is producedA test suite, build, lint or type check run in a sandbox. Pass or fail, not a score out of ten. |
| MetricTime to first token | How it is producedMeasured on the stream, because that is what a person waits for. |
| MetricLatency percentiles | How it is producedPer model across the run, so the tail is visible rather than averaged away. |
| MetricTokens per task | How it is producedFrom the gateway's own ledger rows, not from an estimate. |
| MetricMemory high-water | How it is producedPeak accelerator memory: whether the model fits at all. |
| MetricCost per completed task | How it is producedTotal cost of the run divided by the tasks that actually passed. |
| MetricEnvironment | How it is producedYour hardware, your private cloud, a hosted provider or a frontier API; the hosted and frontier routes are in build. |
| MetricCost basis | How it is producedStated on every row: hardware amortisation and utilisation for a local row, the captured token price and date for a hosted one. Never presented as equivalent. |
| MetricProvenance label | How it is producedVerified for weights we byte-checked; provenance by host attestation, not verified for a hosted route, and hosted routes are in build. A row missing either label is not rendered. |
A human review sample covers the subjective remainder, recorded as a sample rather than a measurement.
A local row also shows cost per completed task across utilisation levels, so you can see the case for hosted first and hardware later.
The dataset stays yours
The golden dataset, tasks with an executable expected outcome, lives in your environment. With no external route enabled, no prompt leaves; with one, it crosses only the route your policy names.
Results are versioned, so the next model is measured against the same bar.
Reading the results
- Results rank the candidates you admitted, on the tasks you ran.
- Re-run when the workload, prompts or settings change.
- Pilot figures describe the evaluation machine; production sizing is part of the pilot's recommendation.
Deciding which model costs less on your own tasks? Heliast runs Compare inside your environment, on your policy.
Book a discovery session